Casual games run the gamut. They can be broken down into a myriad of categories including puzzle, simulation, arcade, hypercasual, and lifestyle. Each category contains its own subgenres as well. For example, puzzle — the most popular category over the last two years — includes word, merge, match-3, bubble shooter, trivia, hidden objects, and more.
According to data.ai, hypercasual (led by the action, puzzle, and simulation genres) was responsible for approximately 33 percent of game downloads in Q3 2021, or about 3.6 billion downloads, which was nearly twice as much as the same period two years prior.
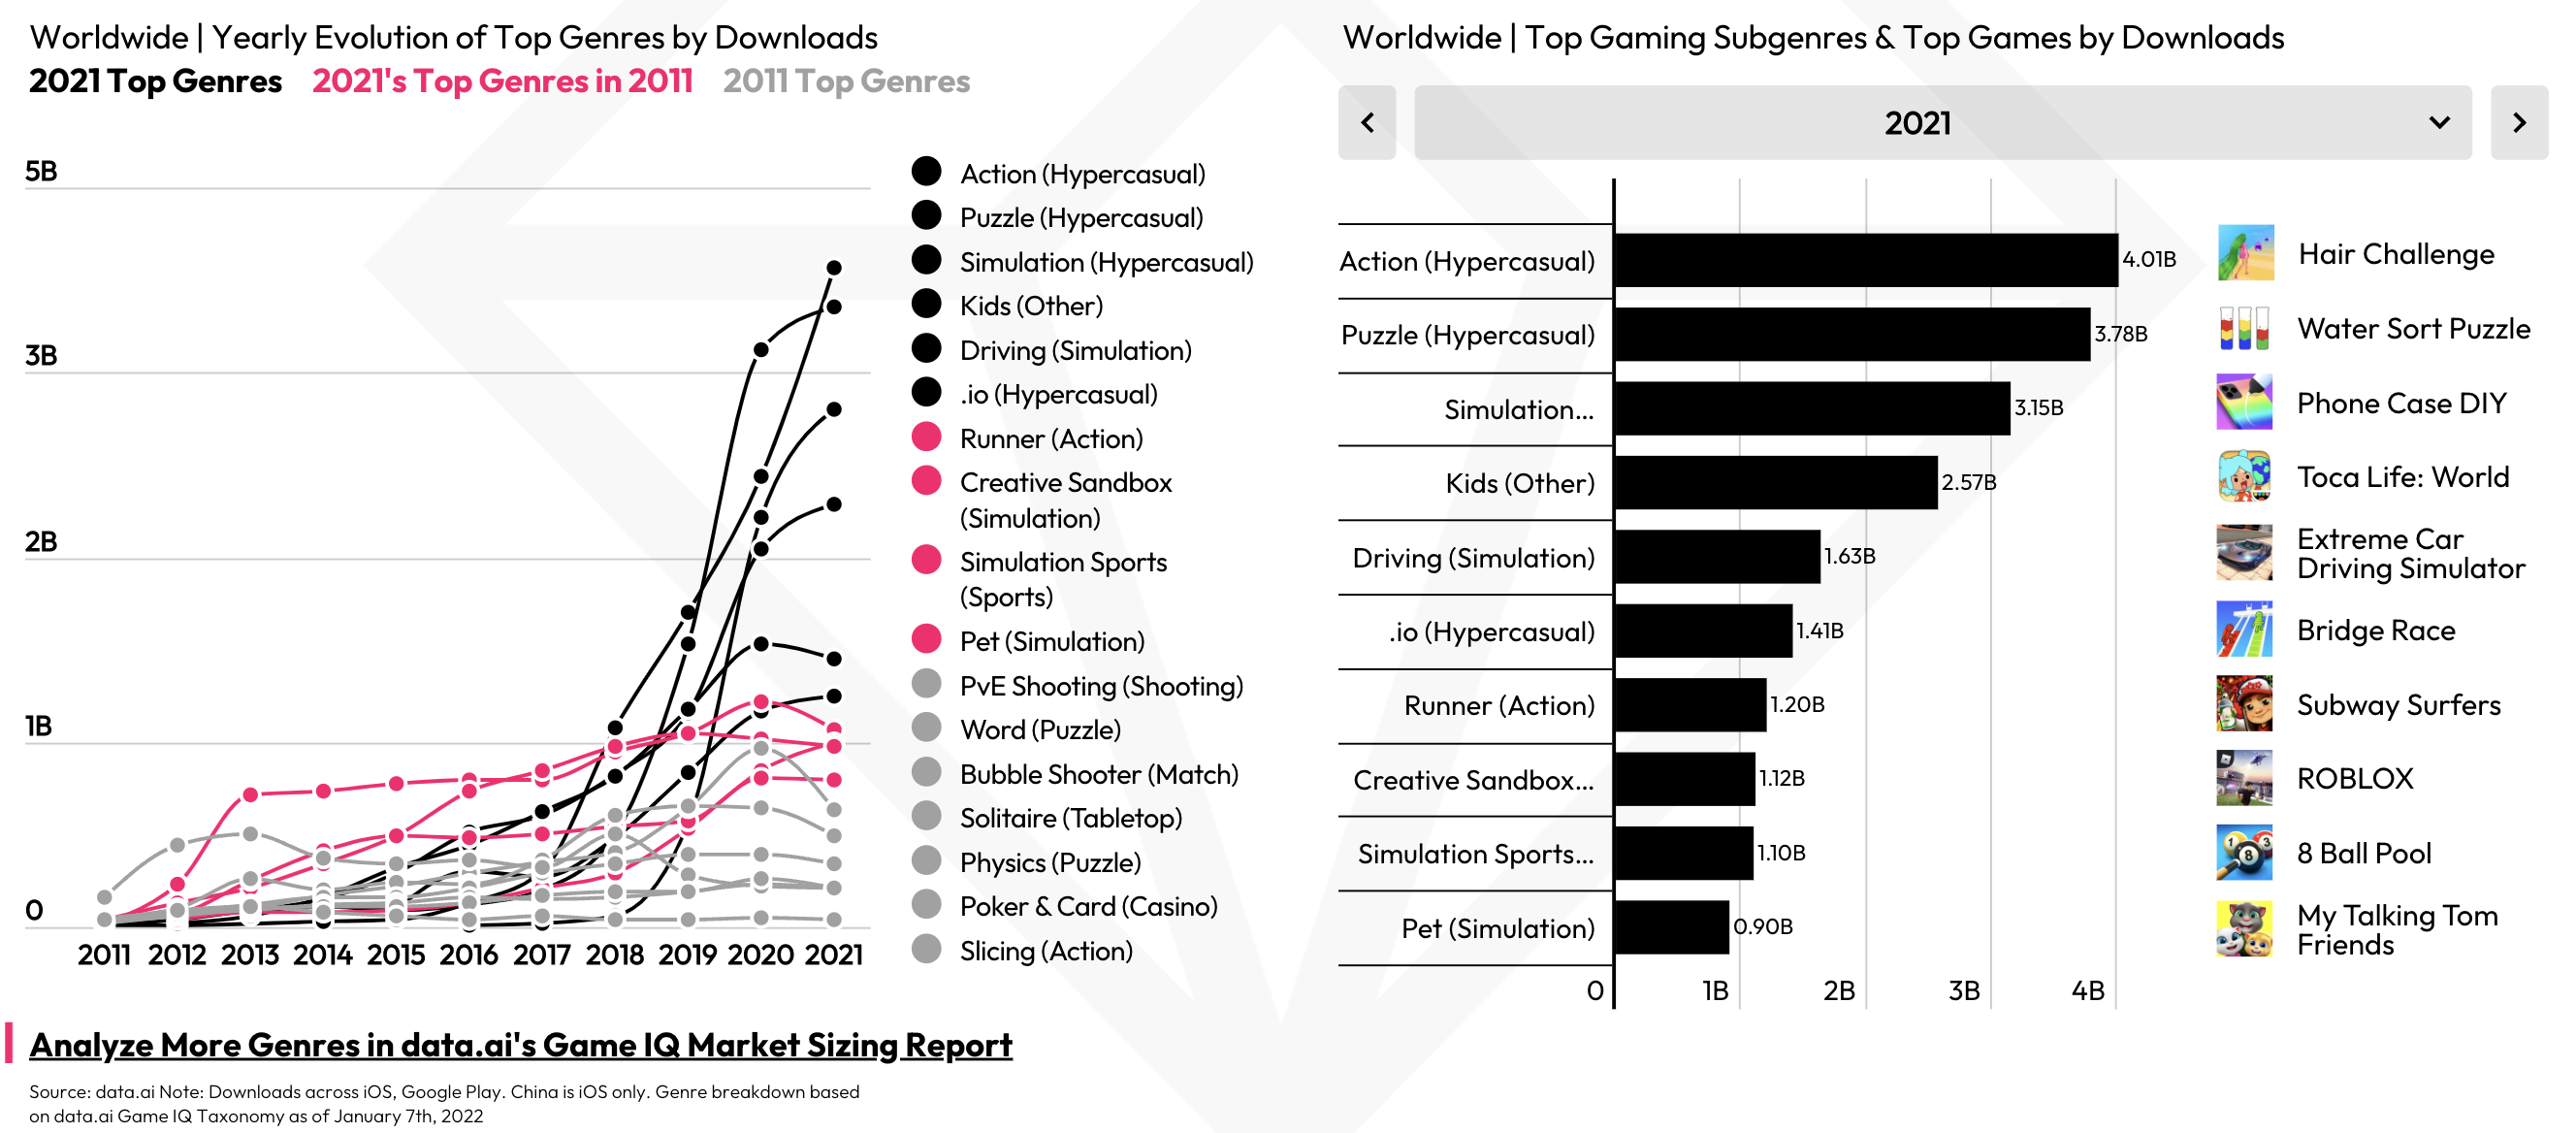
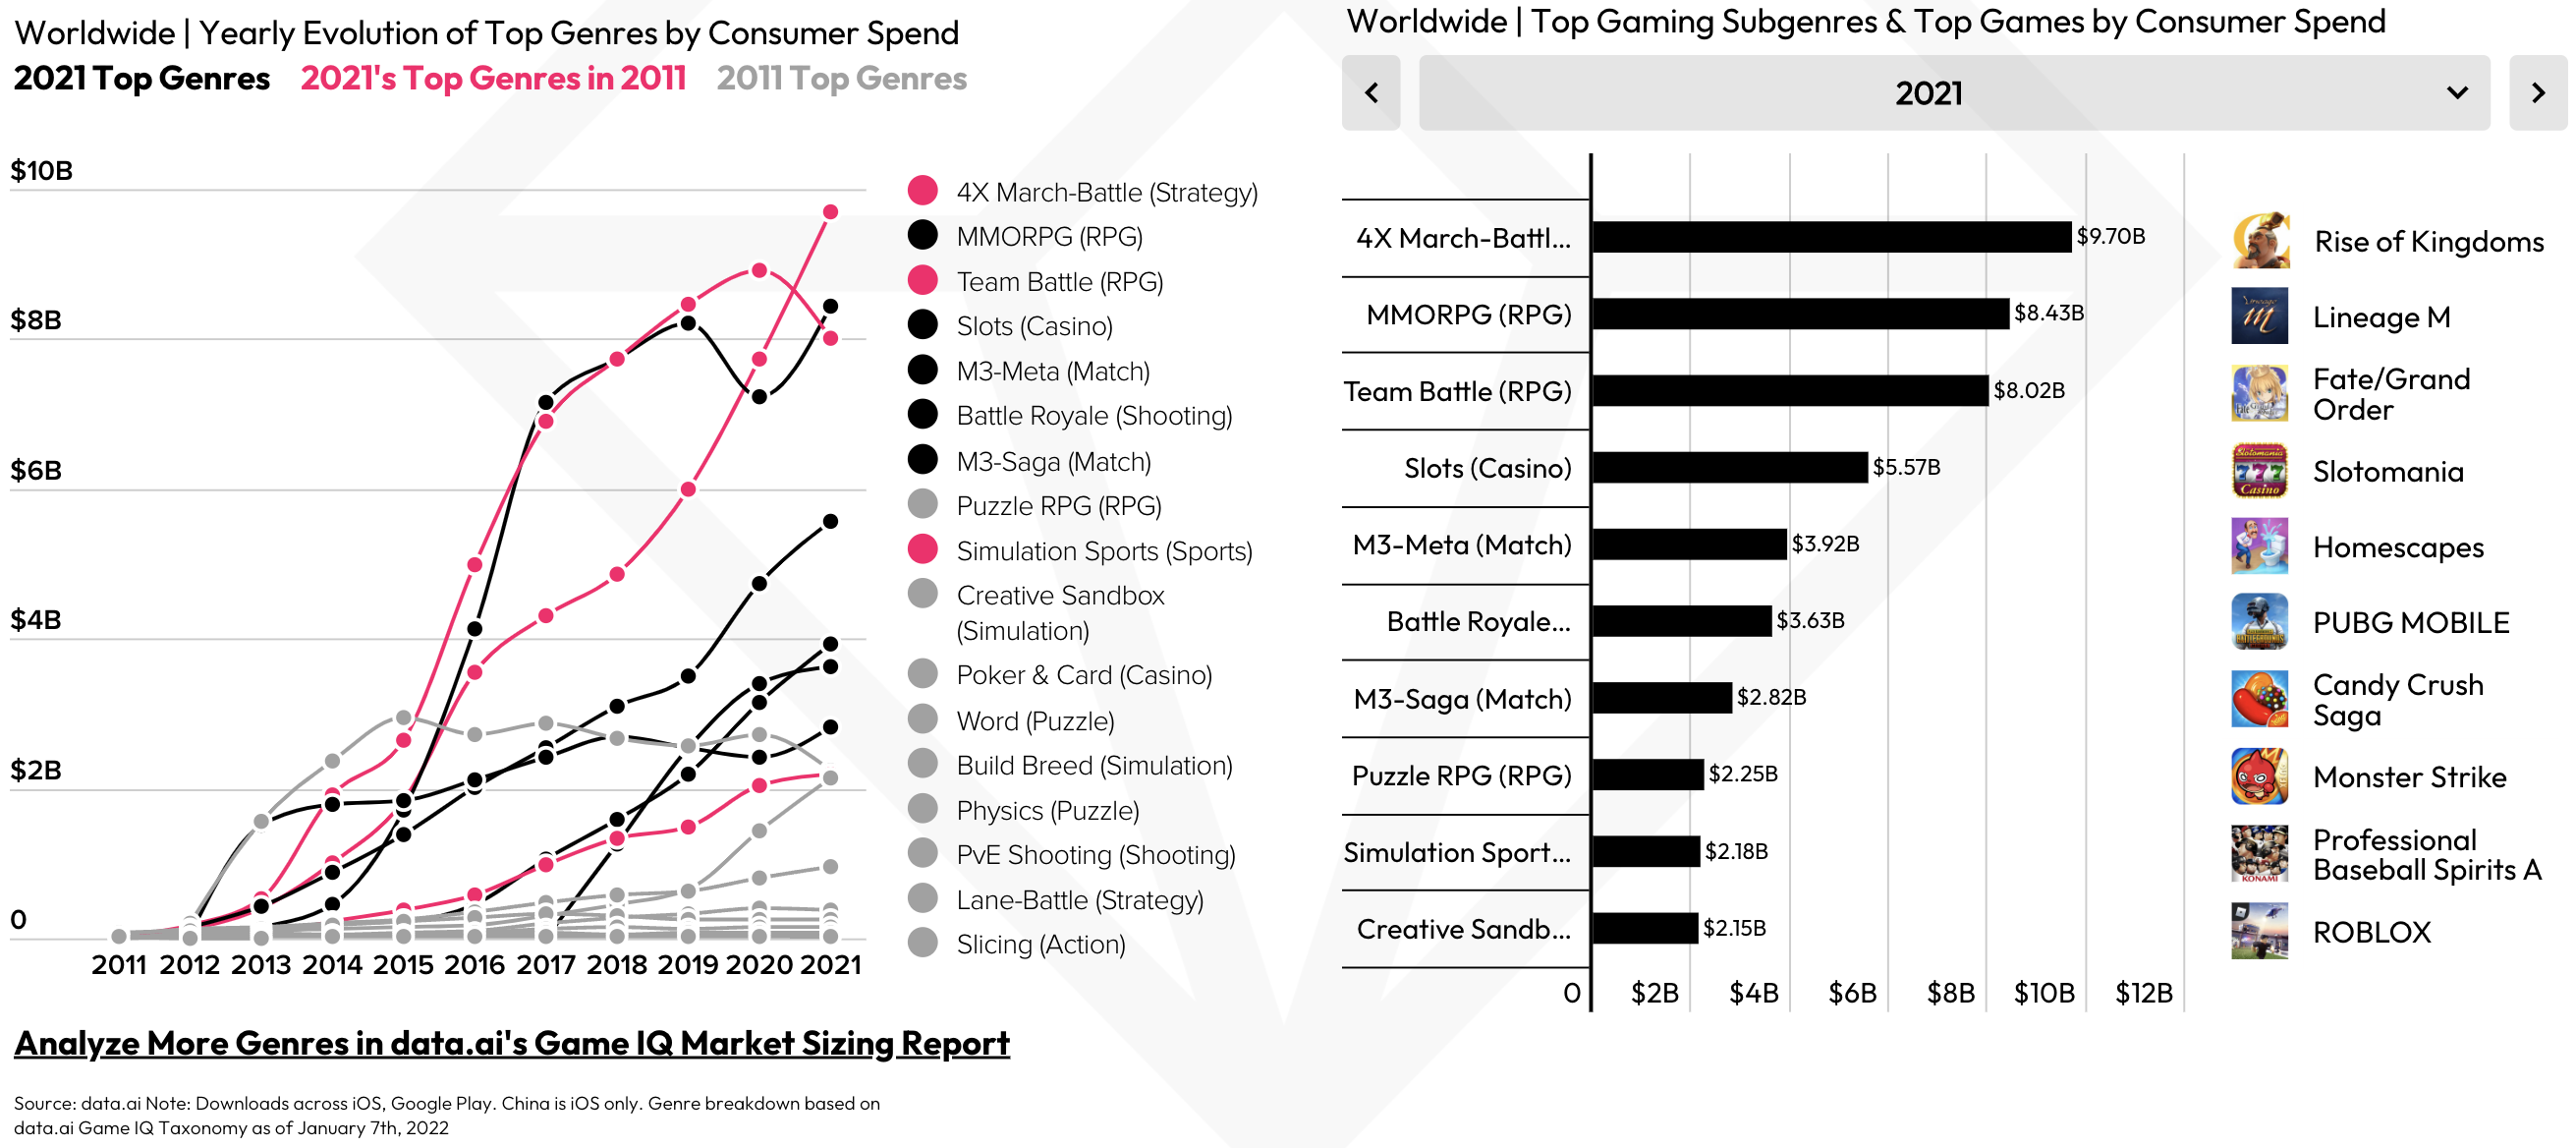
In 2021, match-3 games raked in about $4 billion in revenue, a 25% increase over the year prior, just behind strategy, RPG, and slots.
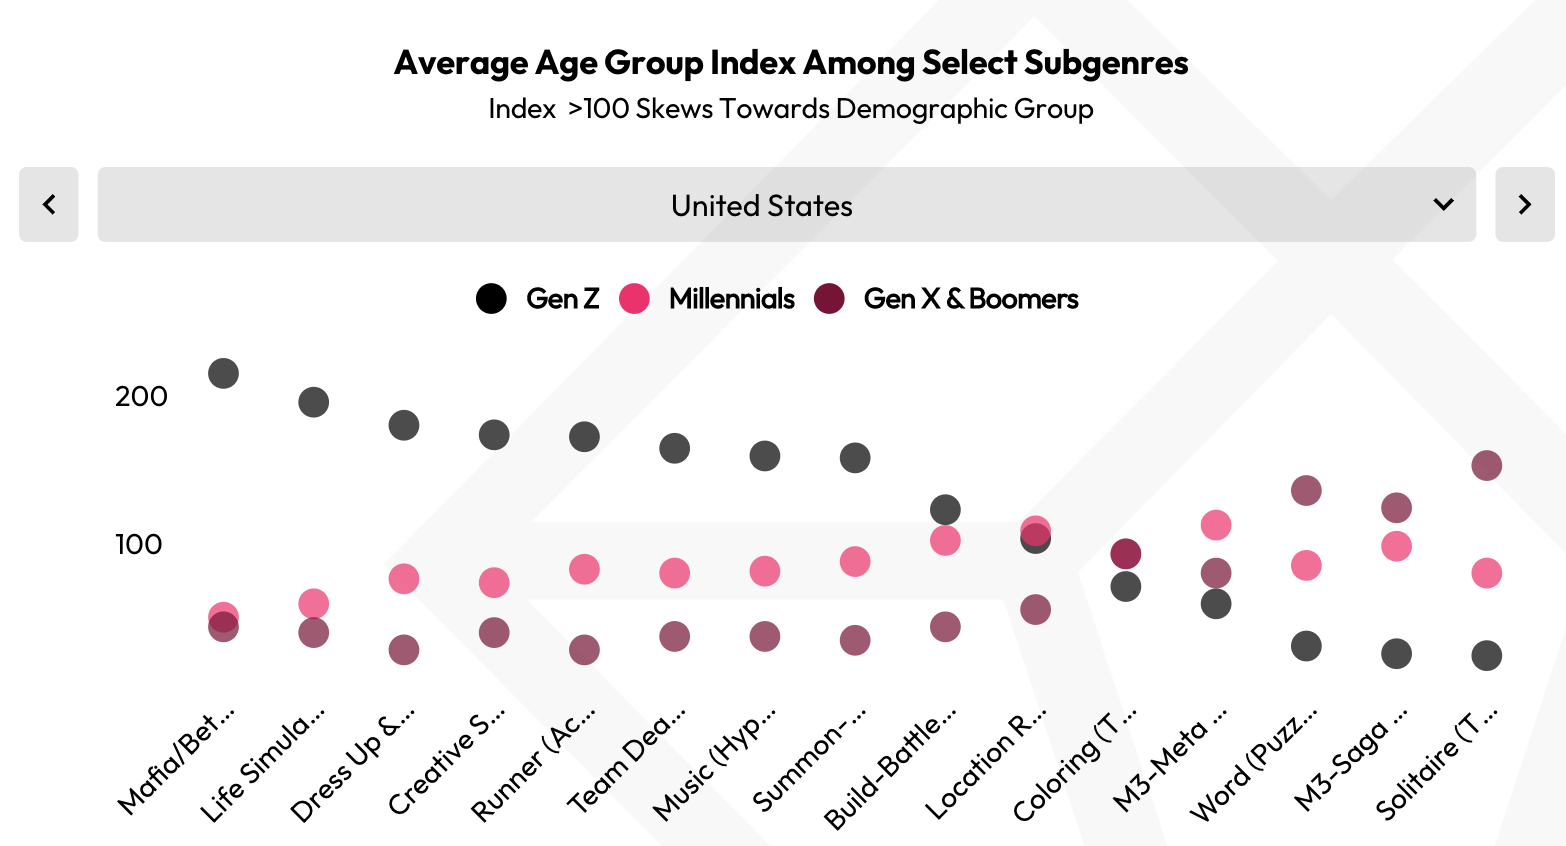
Casual games are popular among middle-aged-and-older women in the US market. Gen Z players gravitate toward party games such as Among Us, while Gen X players are more likely to play solitaire, traditional match-3 games, and word games. Millennials prefer match-3 meta games.
According to AppsFlyer, privacy changes led to a 13% YoY drop in iOS gaming spend versus a 35% surge on Android. In the United States, the United Kingdom, Japan, and Brazil, casual game cost per install (CPI) has increased significantly. Hypercasual has experienced exponential growth at both ends specifically in the United States. Casual ad revenue has also increased steadily.
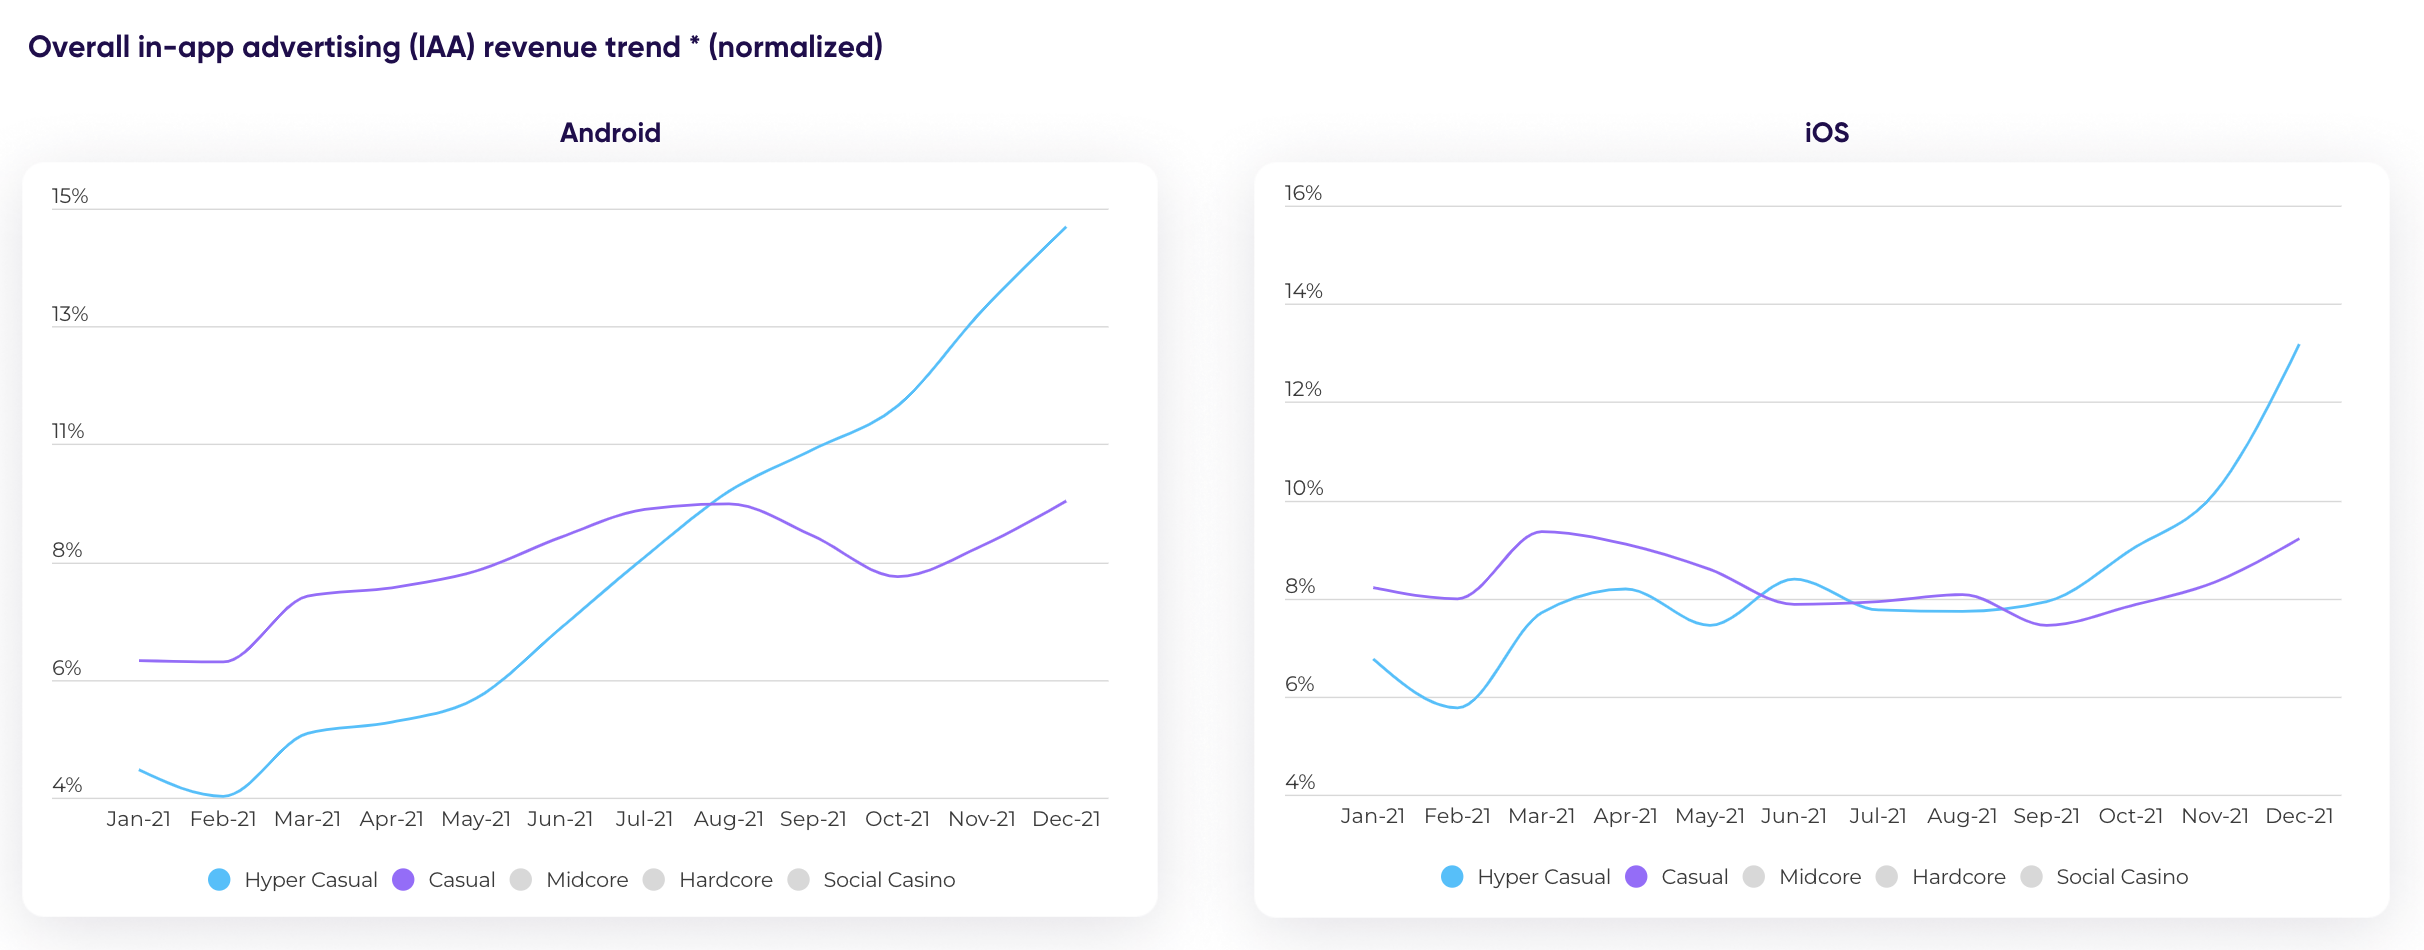
The ad revenue boost at year’s end was due mainly to Christmas promotions and increases in advertiser budgets. A similar situation occurred in the UK market. The growth of Android is relatively obvious, but iOS also picked up by year end.
Latin America is an emerging market for casual games. Casual games became more popular in the region with a 125% download increase on Android, a 152% ad revenue increase on Android, and a 30% increase on iOS. This pickup is due in part to the average 30-day retention rate of Latin American casual gamers climbing as high as 7.6% as well as their propensity to stay long enough to watch in-game ads.
Hypercasual ad revenue is a great opportunity that publishers cannot miss. According to Unity, 37% of casual game revenue comes from ad revenue — quite the contrast from hypercasual games, which garner 94% of earnings from ad revenue.
It is vital that publishers choose a reliable mediation platform to maximize ad revenue. Chartboost Mediation supports both in-app bidding and waterfall solutions.
Next up, Chartboost’s effective cost per thousand impressions (eCPM) by different ad formats in different countries from September 2021 to March 2022.

Chartboost rewarded video eCPM on Android was much higher than than on iOS. On Android, the United States held firmly above $20 (USD) per 1,000 impressions, while the holiday season helped Australia come on strong to reach nearly $25 per 1,000 impressions. Tier-2 countries have trailed behind, with Japan surging past as its eCPM steadily increased. On iOS, the United States has the highest eCPM, followed by Japan and then Australia, with no significant fluctuation to report.

Chartboost interstitial eCPM on Android came in higher than on iOS too. In Q1 2022, Australia and US interstitial eCPM on Android achieved more than $15 per 1,000 impressions. On iOS, the United States had the highest eCPM with an average of $10 per 1,000 impressions, followed by Japan at $8 and Australia at $7.

Because they’re purchased mostly by brand advertisers to increase awareness, banner ads haven’t been impacted much by Apple’s privacy policy. We didn’t see significant fluctuation in eCPM for casual game banners on Android or iOS. Android eCPM is slightly higher than iOS — the United States offers the most value at between $1.50 to $2 per 1,000 impressions.
Now that you see the trends, how should you react? Read Casual Game Monetization Best Practices to learn how to target as many users as possible and keep them engaged right now.
In the meantime, contact the Chartboost Supply Team to discuss more market trends and how you can leverage them to deploy flat CPM and monetization strategies effectively.
